Monitoring the Sales Dimension application using dtManage
Recall that after the application is built and validated, it can be launched from the App Packages page as described in an earlier chapter; applications built with dtAssemble can also, optionally, be launched from the Application Canvas page as described earlier. This section describes how you can monitor the running Sales Dimension application using dtManage.
The Monitor menu option
You can monitor the Sales Dimension application by clicking Monitor on the menu bar. After you click Monitor, you can choose between 4 tabs. Under each tab, you can see multiple widgets, which you can resize, move around, configure, or remove.
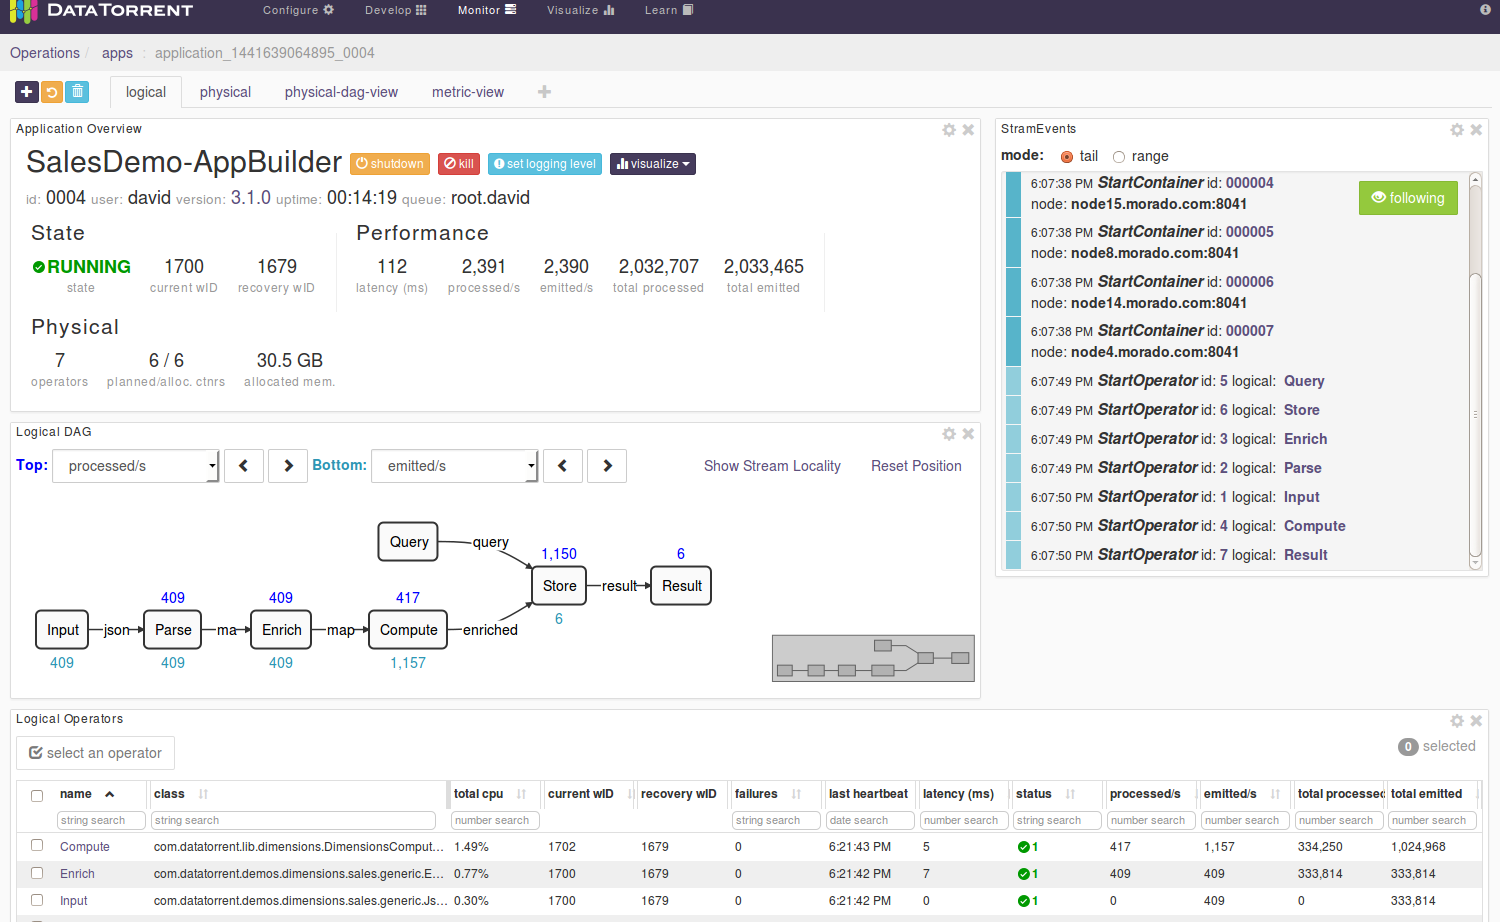
logical
This image of the logical tab shows 4 widgets; additional widgets can be added by clicking the + button at the top-left corner and choosing from the resulting dropdown list.
-
Application Overview
This widget has the shutdown and kill buttons for shutting down or killing an application. This widget also displays the state of the application, the window IDs, the number of physical operators, containers, allocated memory, and statistics on the number of events handled.
-
StramEvents
This widget displays all the operators, containers, and nodes that are running. This widget also displays additional information, such as errors encountered and timestamps.
-
Logical DAG
This widget displays operators and their connections in the logical dag (as defined in the application) without partitions, that is, if an operator is partitioned to run multiple copies to increase throughput, only one copy is displayed. The Physical DAG (the physical-dag-view) shows the actual physical operators. For each operator, you can choose to include additional statistics.
To include additional details
- Click an operator for which you want to display additional details.
- To display a detail on the top of this operator representation, click the Top list, and select a metric.
- To display a detail at the bottom of this operator representation, click the Bottom list, and select a metric.
-
Logical Operators
This widget displays a table of operators for: the name, the Java class, status, and additional statistics for latency and processed events.
-
Streams (not shown in the image)
This operator displays a table with one row per stream showing: the name, locality, source, and sinks.
-
Metrics Chart (not shown in the image)
This widget displays moving averages of tuples processed and latencies.
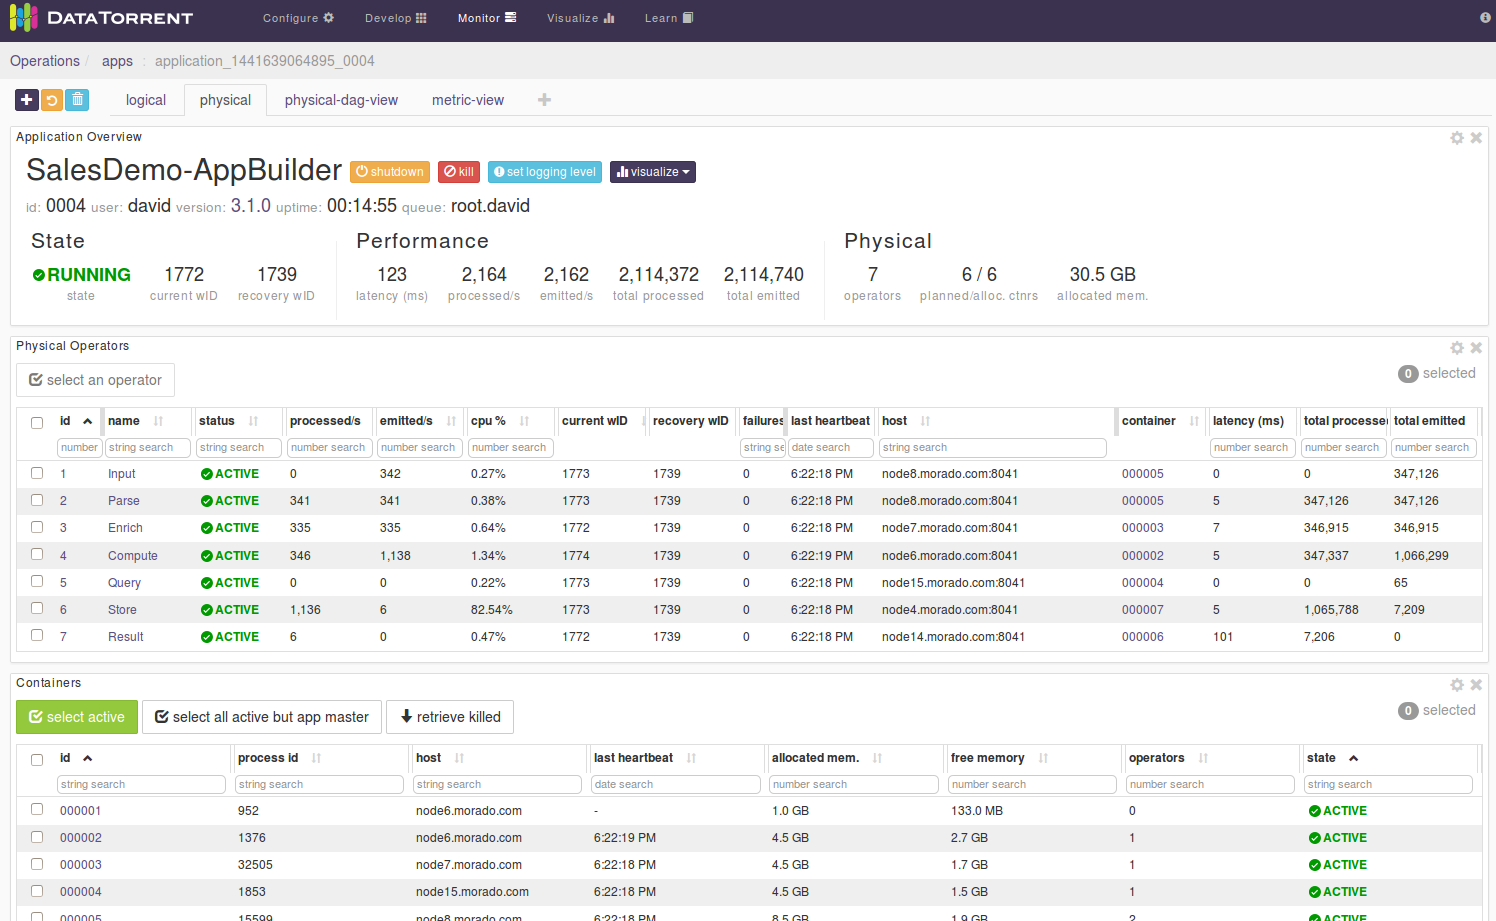
physical
The physical tab displays, in addition to Application Overview and Metrics Chart, 2 more widgets:
-
Physical Operators
This widget displays a table of physical operators for: name, status, host, container ID, and some additional statistics. The container ID is a numeric value and a clickable link that takes you to a page showing additional details about that specific instance of the operator.
-
Containers
This widget displays a table of containers (the Java Virtual Machine processes) and for each process: the ID, the process ID, host, the number of hosted operators, and some additional memory statistics.
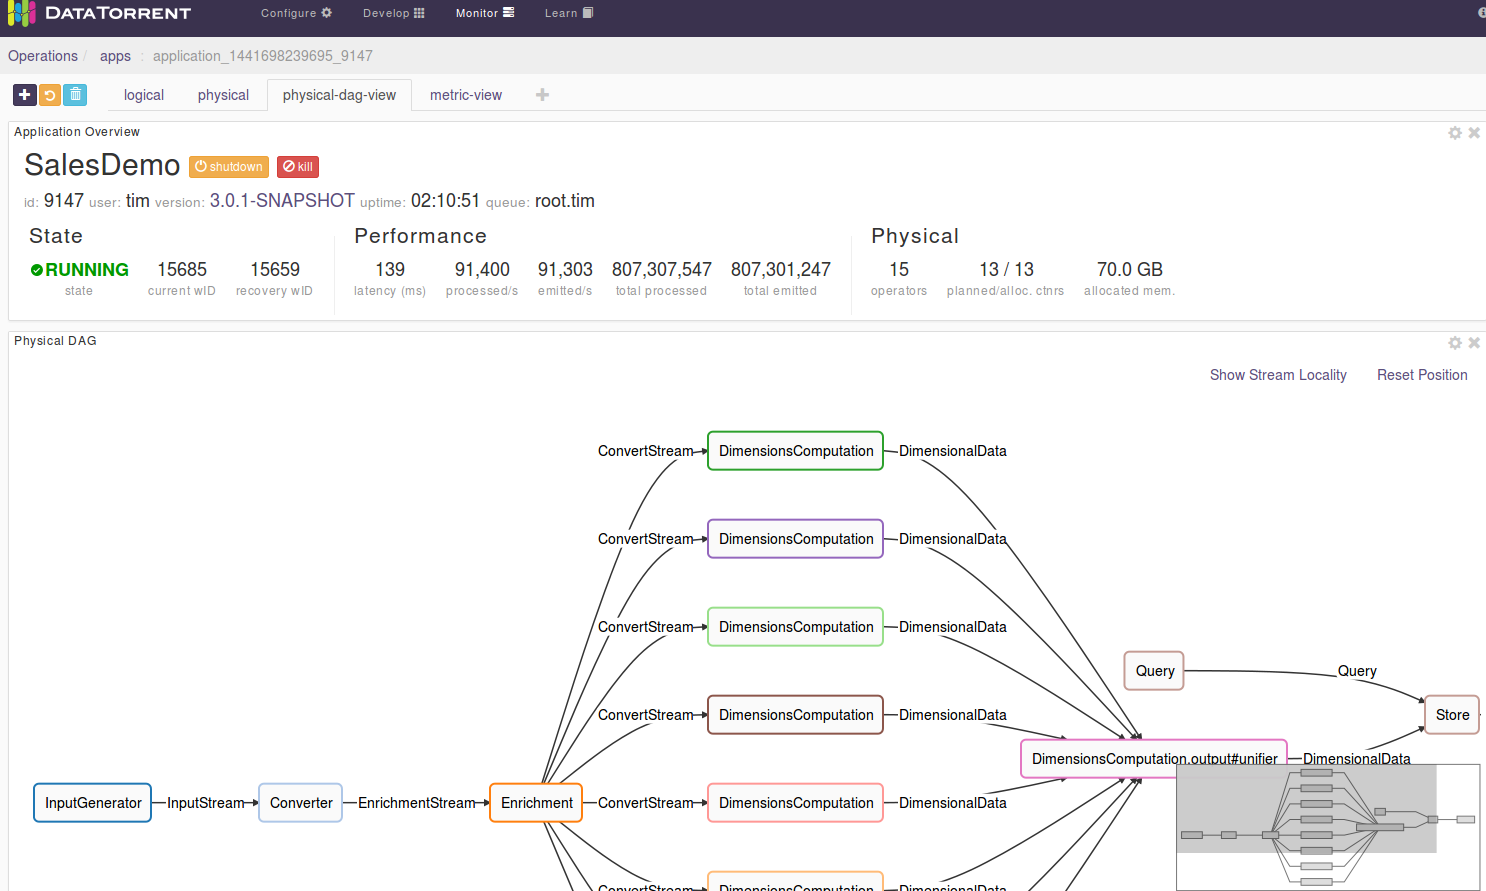
physical-dag-view
The physical-dag-view tab displays the Physical DAG widget, which shows all the partitioned copies of operators and their interconnections:
metric-view
The metric-view tab displays only the Metrics Chart widget.
Monitor Sales Dimension using the Monitor menu
To monitor the application
- Click Monitor on the menu bar to open the logical view of the DAG.

- Ensure that the State is Running, indicating that the application is launched successfully.
- Under StramEvents, ensure that the operators from within the application have started.
- Click physical tab to open the physical view.
-
Ensure that the Input, Parse, Enrich, and Compute operators are deployed to a single container.

Note: This is because we set the corresponding stream locality to
CONTAINER_LOCALearlier. This parameter is an example of performance improvement technique, which eliminates data serialization and networking stack overhead between a group of adjacent operators.
Create additional tabs
You can create custom tabs in addition to logical, physical, physical-dag-view, and metric-view. Under each tab, you can add widgets, and customize these widgets according to your requirements. This enables a deeper insight into how the Sales Dimension application works. Each tab, default or otherwise, contains the Application Overview widget.
To create additional tabs
- Next to the metric-view tab, look for the plus sign (+) button.
- Click this button to create an additional tab.
- Provide a name for your tab.
- Add widgets to your tab.